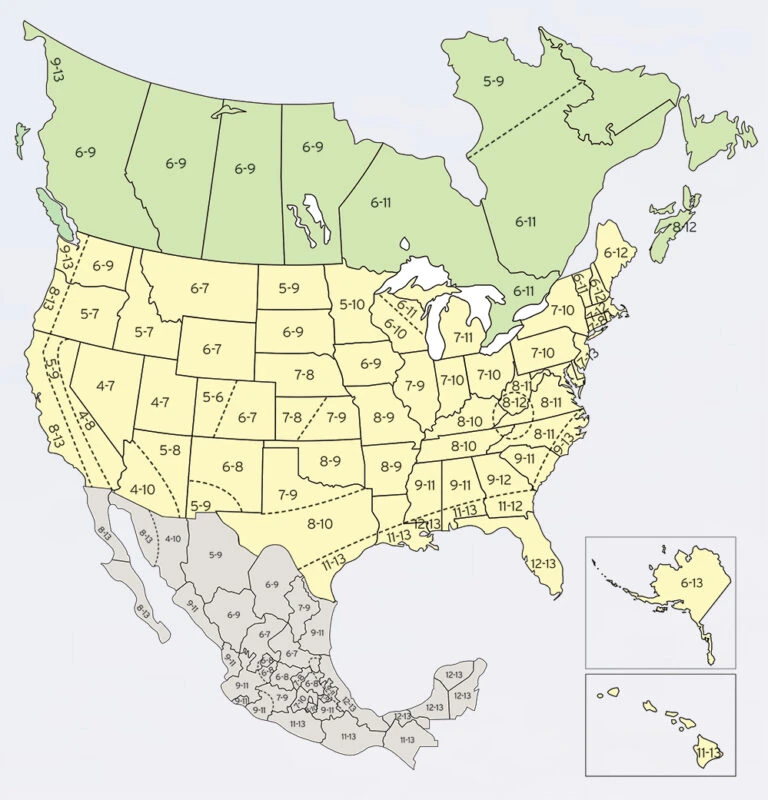
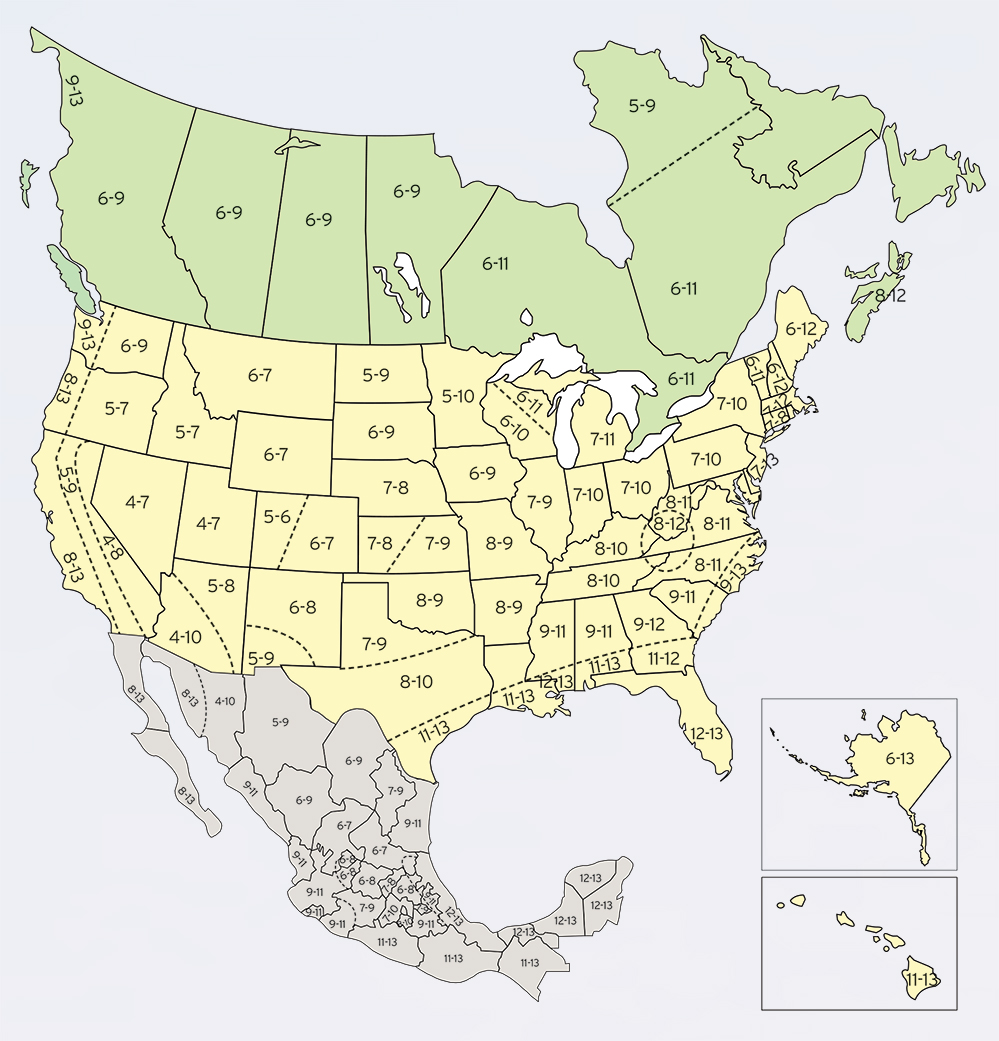
Moisture content in wood and building materials is directly influenced by surrounding humidity. The moisture map shows how average moisture contents for wood products vary from one region to another, and from one season to another. Actual moisture content conditions in any region may vary significantly from these numbers. Printed with permission from the NWFA.
The map can help wood product manufacturers, builders, furniture and floor installers, inspectors, and home owners better understand how the climate zone in which they live and work affects wood and other building materials. The map is used to determine the right wood moisture content range for your region and season.
Zones on the moisture map represent areas that experience similar relative humidity conditions. Each zone’s listed range indicates the maximum fluctuation in moisture content that typically occurs throughout a single year.
Seasonal Variability
The moisture content in wood products can vary significantly within the same zone depending on the season. Per season changes can range from 9-13% or from 4-10%.
Why It Matters
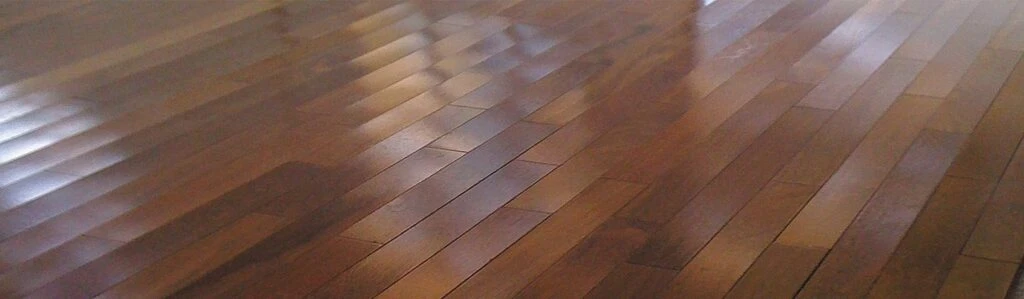
If wood is exposed to different humidity levels, it will gain or lose moisture – leading to shrinking, warping, cupping and other moisture related defects.
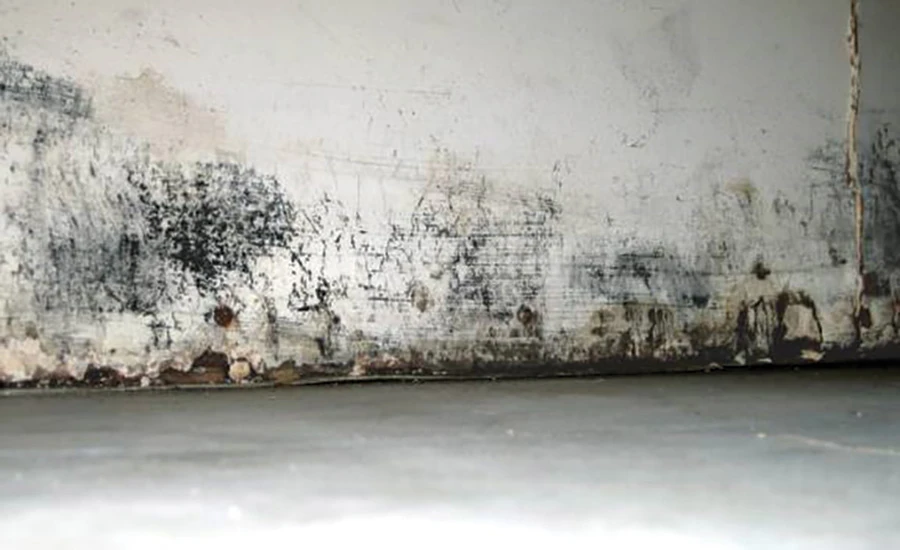
Moisture problems in wood, drywall, and other building materials wouldn’t be a concern—if it weren’t for:
Wood and most building materials are hygroscopic, meaning they absorb or release moisture based on the humidity of the surrounding air. When they reach the Equilibrium Moisture Content (EMC), moisture movement stops.
However, if humidity levels change, the material will gain or lose moisture—leading to the problems listed above.
Whether wood is properly acclimated depends on its moisture content and the humidity of the surrounding, as shown in the EMC chart.
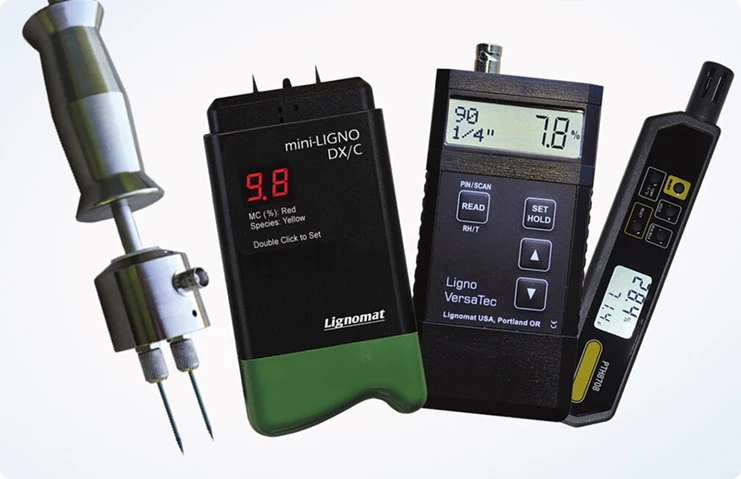
Use a thermo-hygrometer to measure the relative humidity of air and a moisture meter to test the material.
Moisture Meters and Thermo-Hygrometers help verify whether materials have the desired moisture content and are in an equilibrium with the surrounding air. Meters like the Ligno-VersaTec or the Ligno-DuoTec BW can test both moisture and humidity.
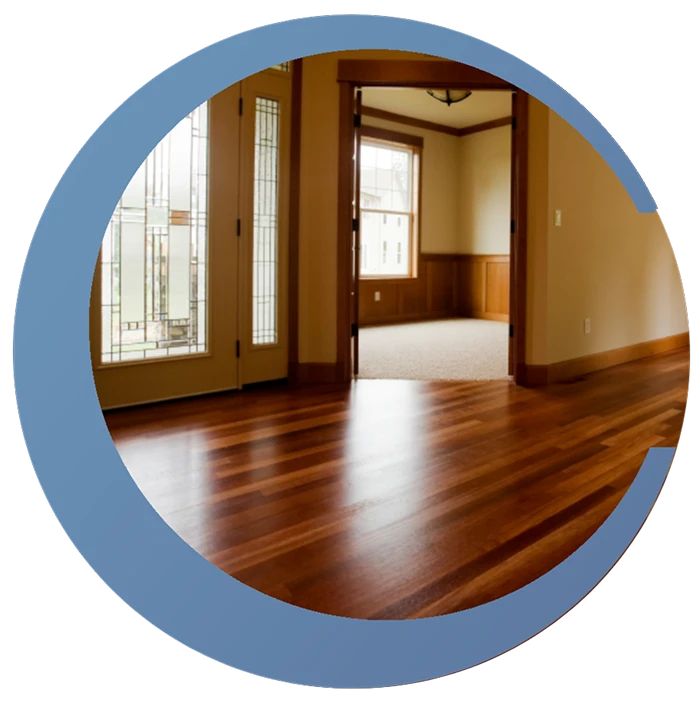
Whether you’re drying lumber, installing flooring, or inspecting a property, regional EMC matters. This map gives you a starting point—but real confidence comes from pairing it with accurate on-site readings.